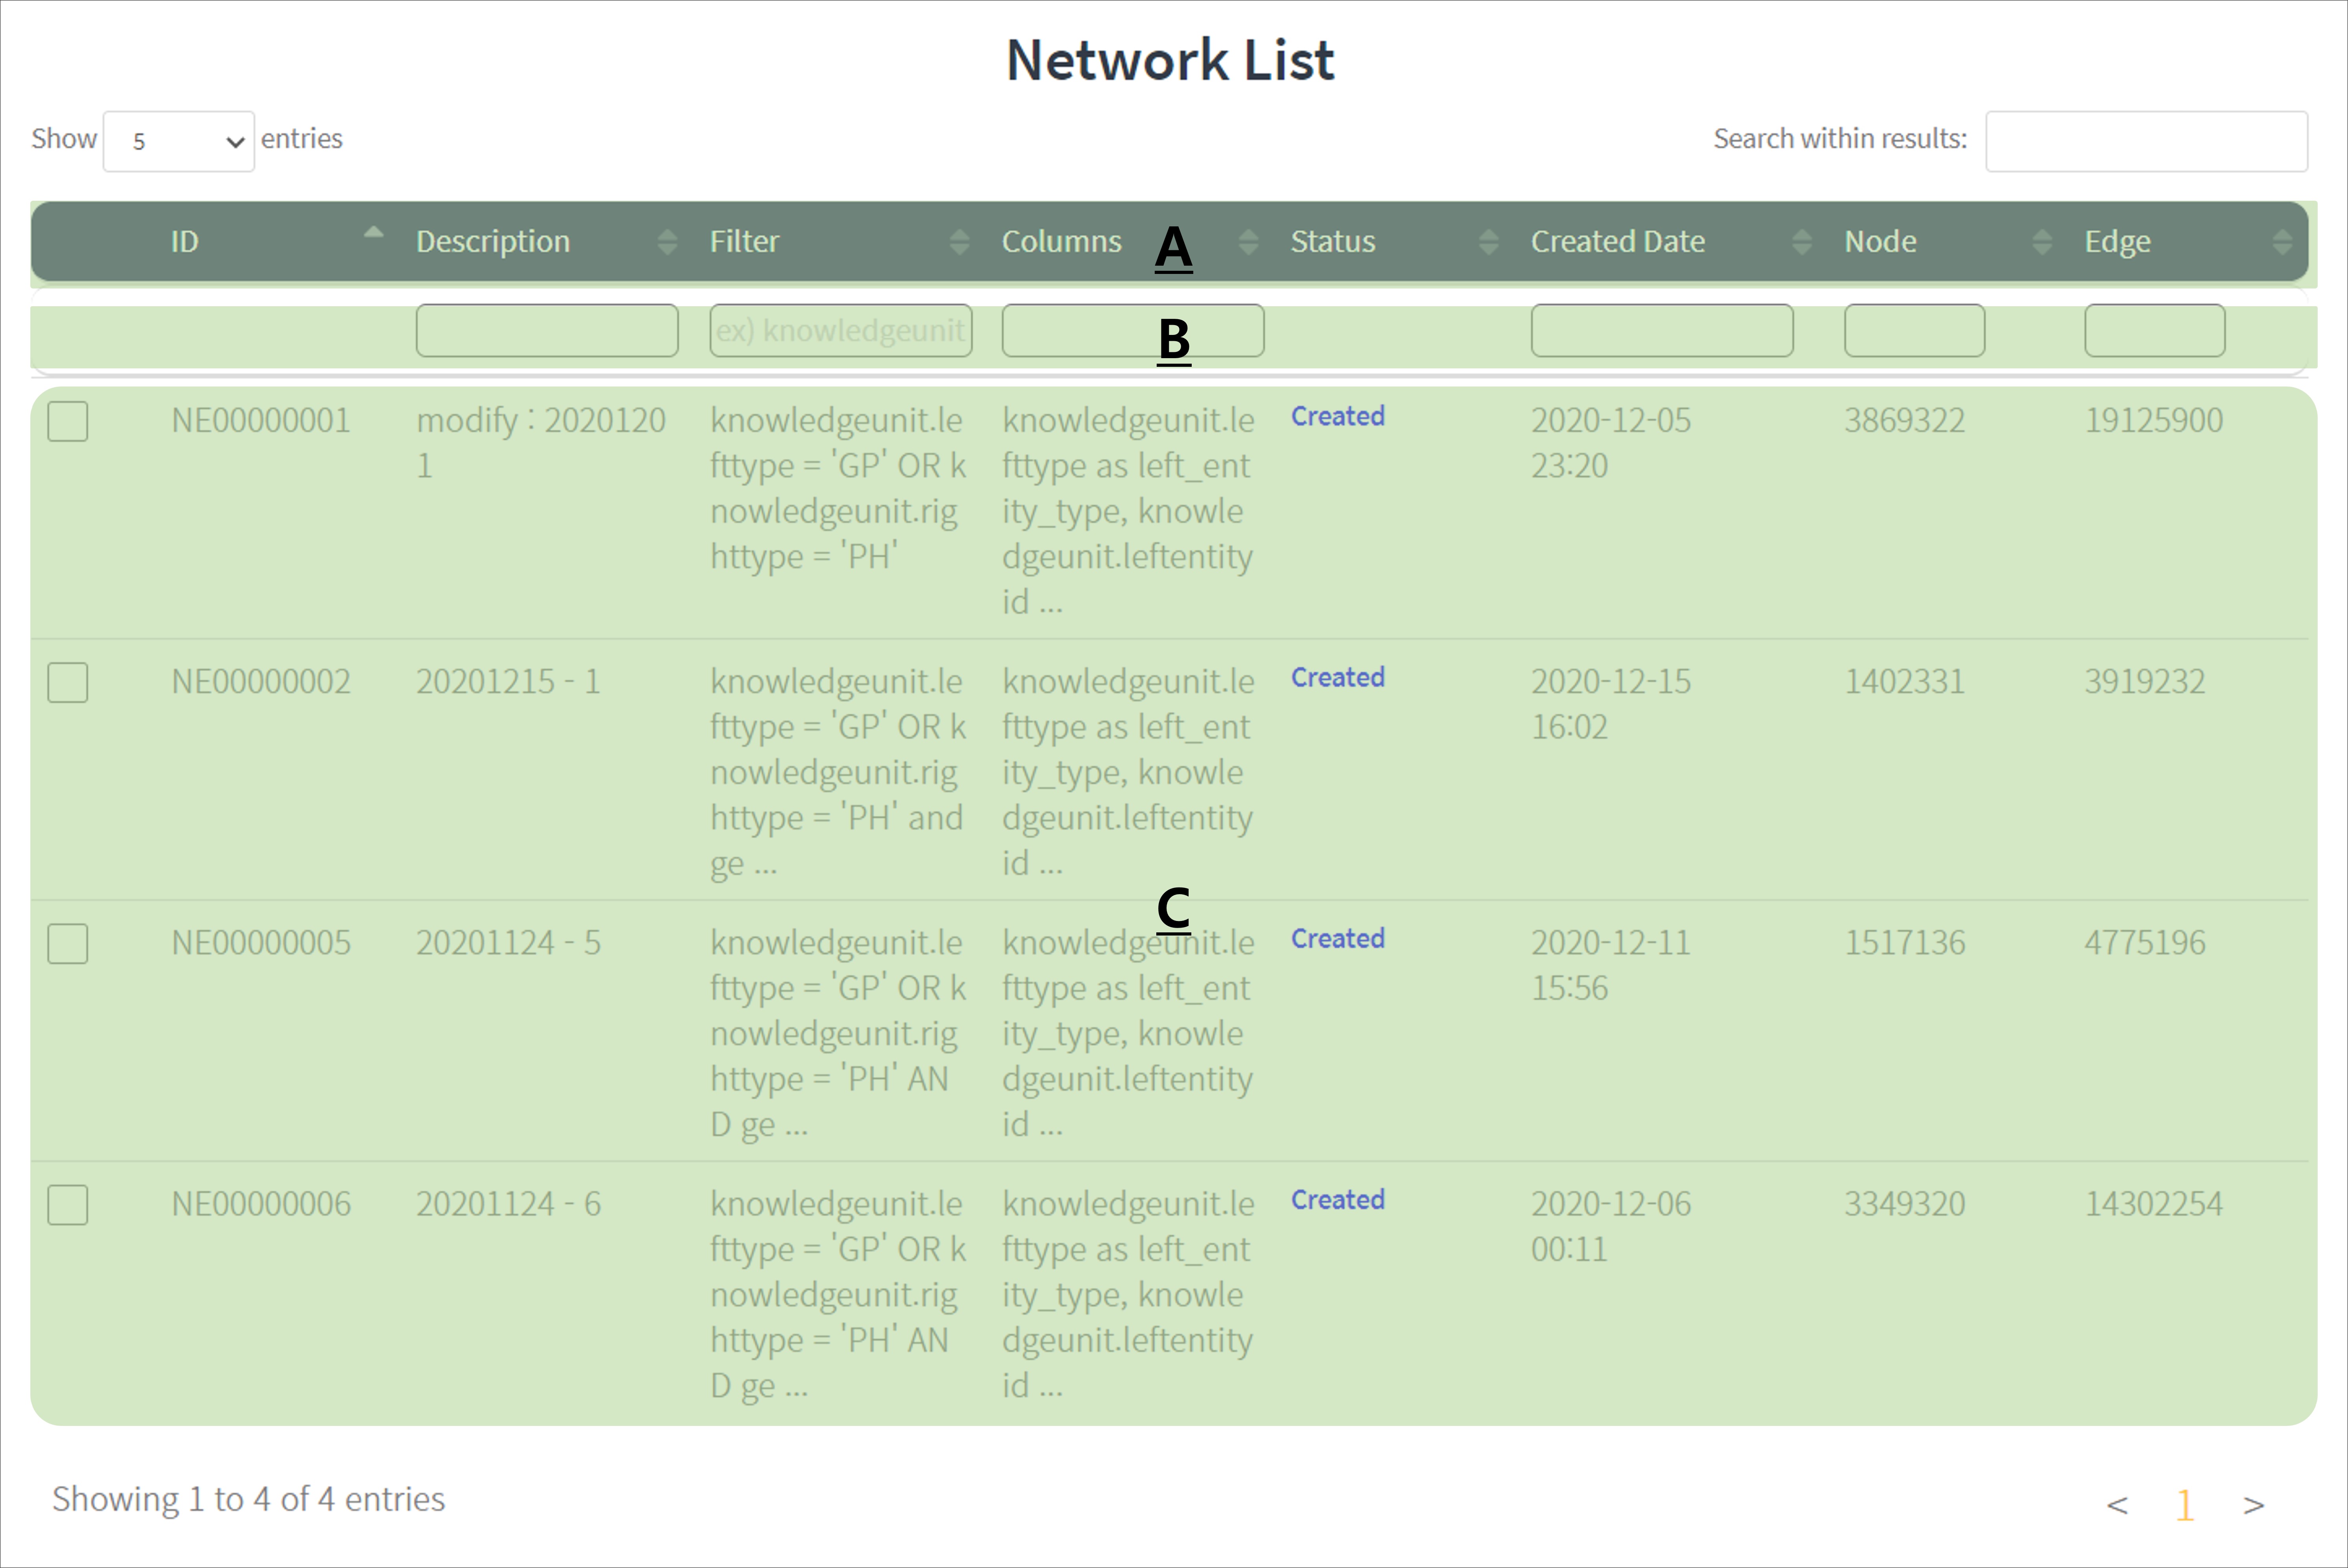
A : Sort the list based on each column in ascending or descending order.
B : Search a keyword from each column.
C : Detailed information of each network.
Table Column Explanation
Description : A brief description of the network
Filter : A condition which is used to create the network
Columns : Columns which the network contains
Status : A state of the network
Created Date : The date of the network creation
Node : A number of nodes in the network
Edge : A number of edges in the network
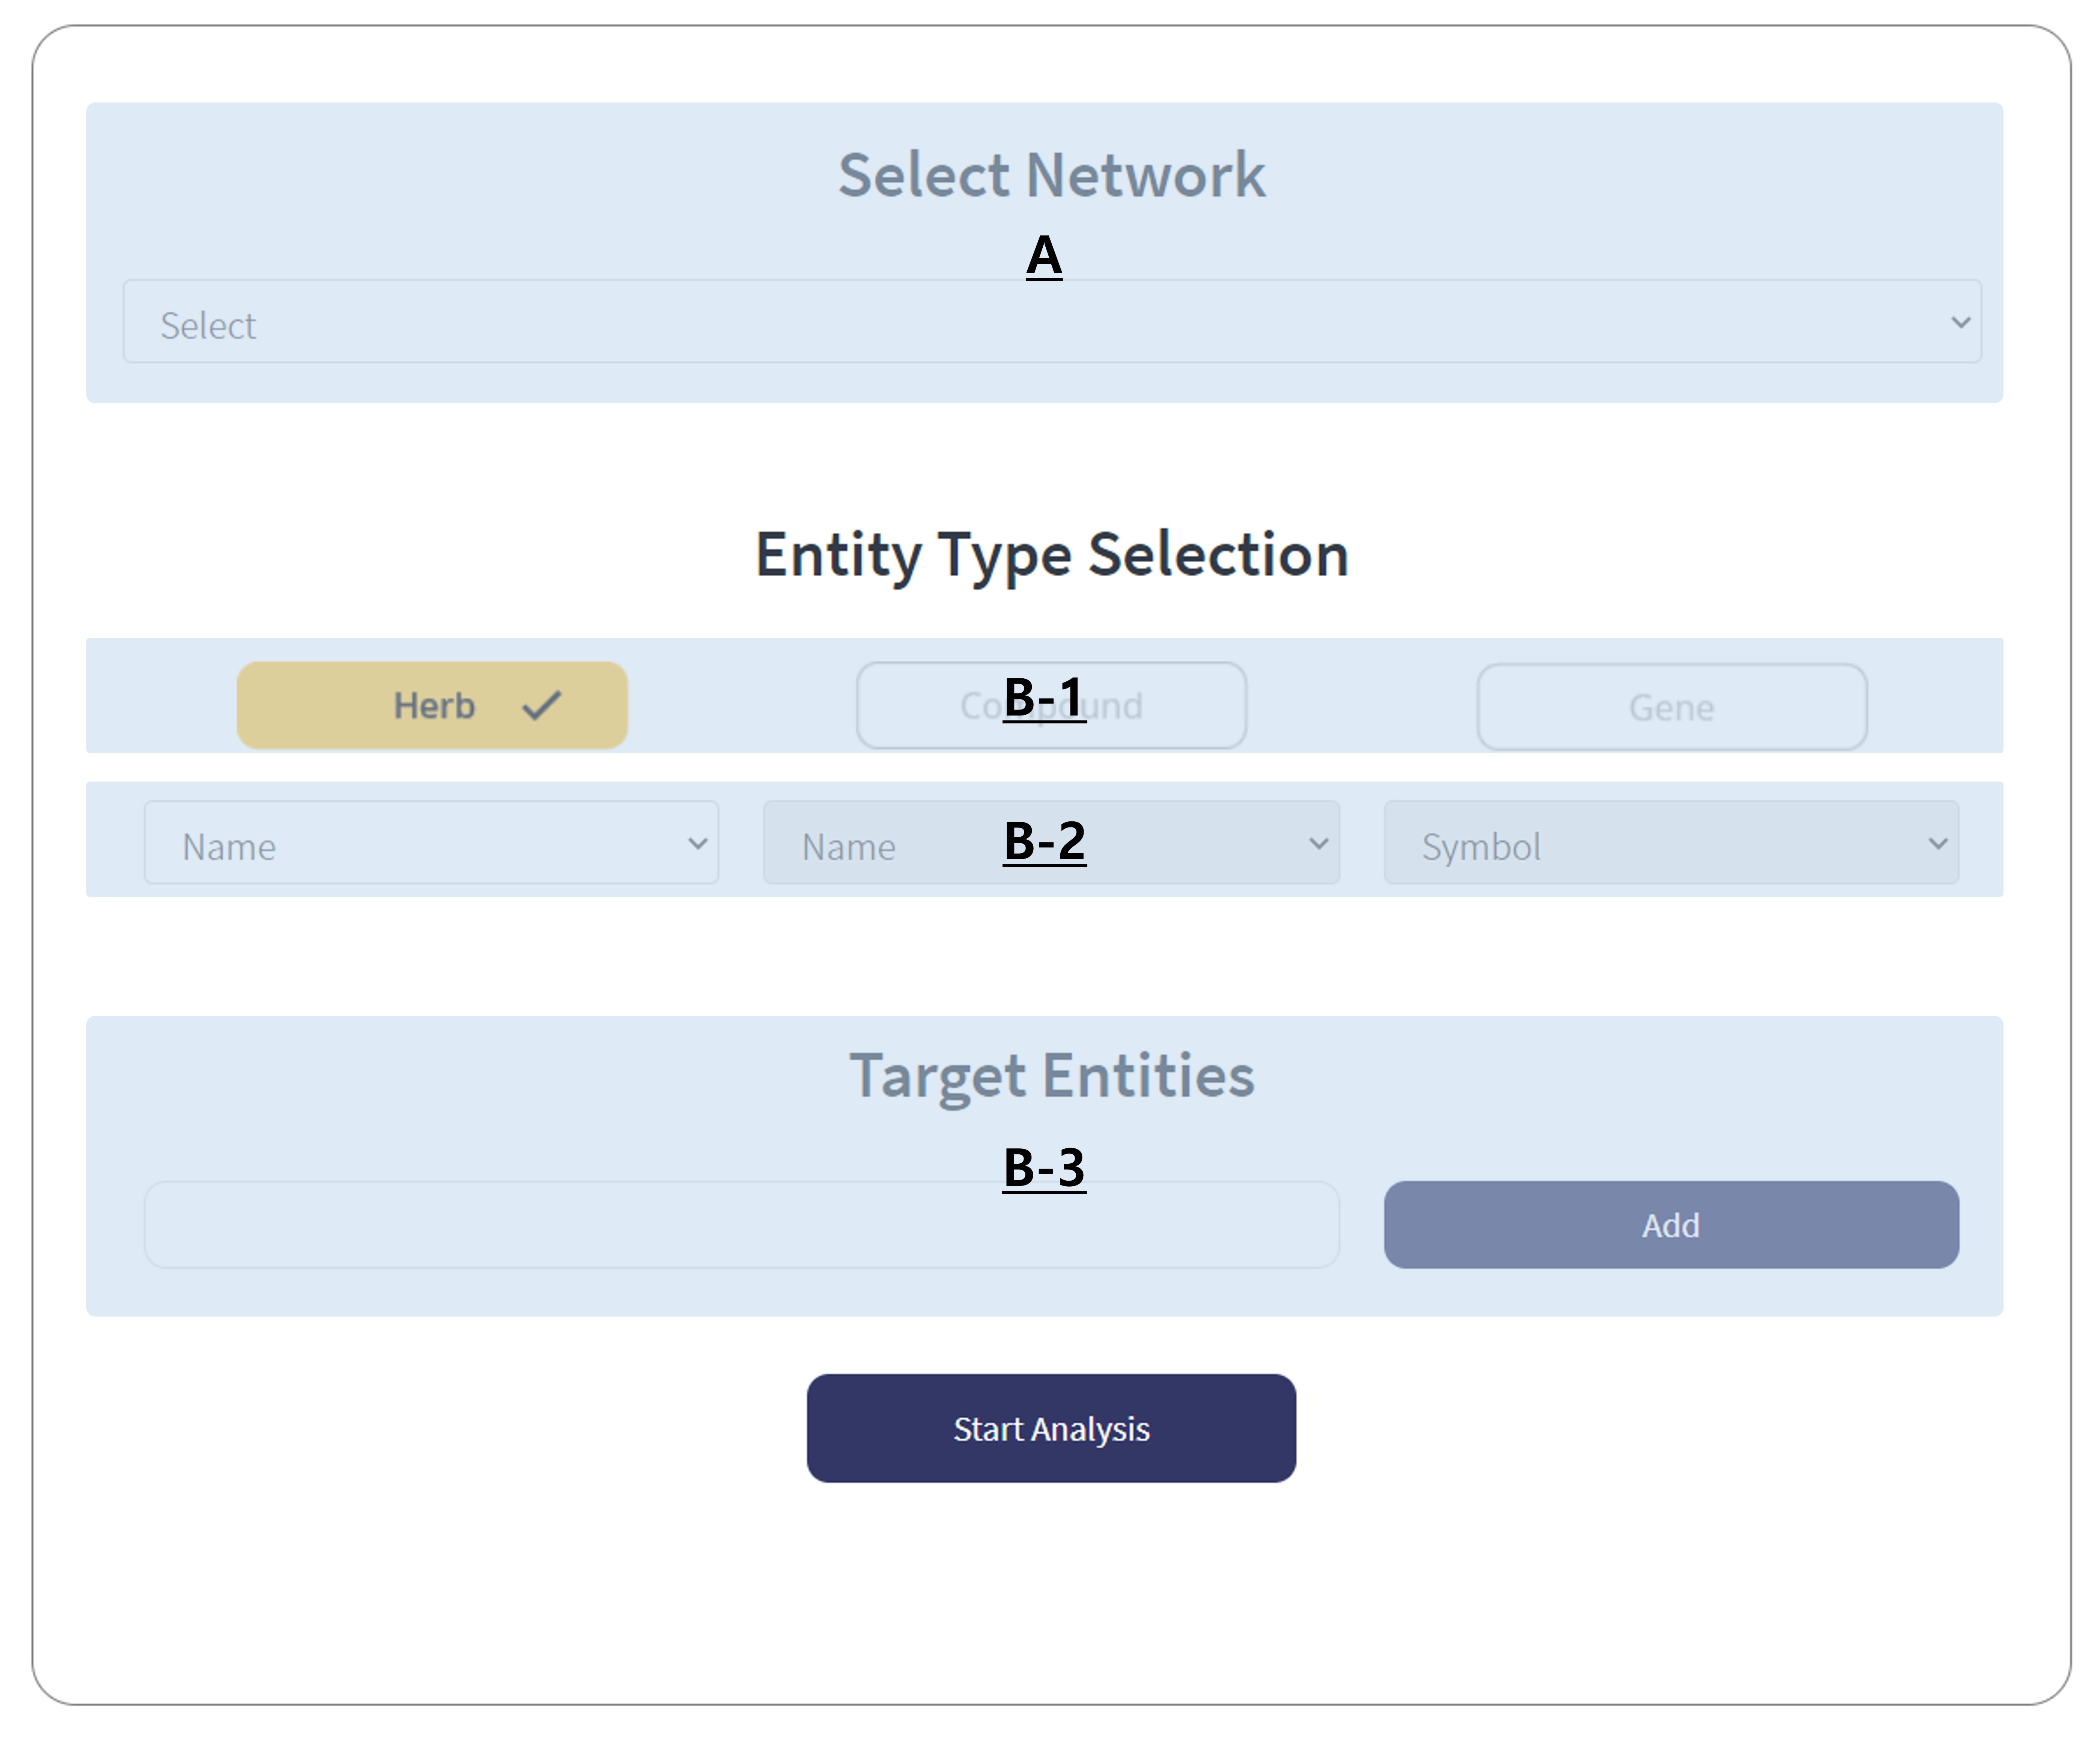
How to do ‘Effect Prediction’ analysis
Select a network depending on your analysis purpose.
(A) The detail descriptions of networks are described in the section of ‘How to select a network?’.
Choose a type of entity among ‘herb’, ‘compound’, and ‘gene’. (B-1)
Select an ID type which you want to search. (B-2)
Write down a entity or entities with appropriate type you choose above. (B-3)
Click the ‘Start Analysis’ button
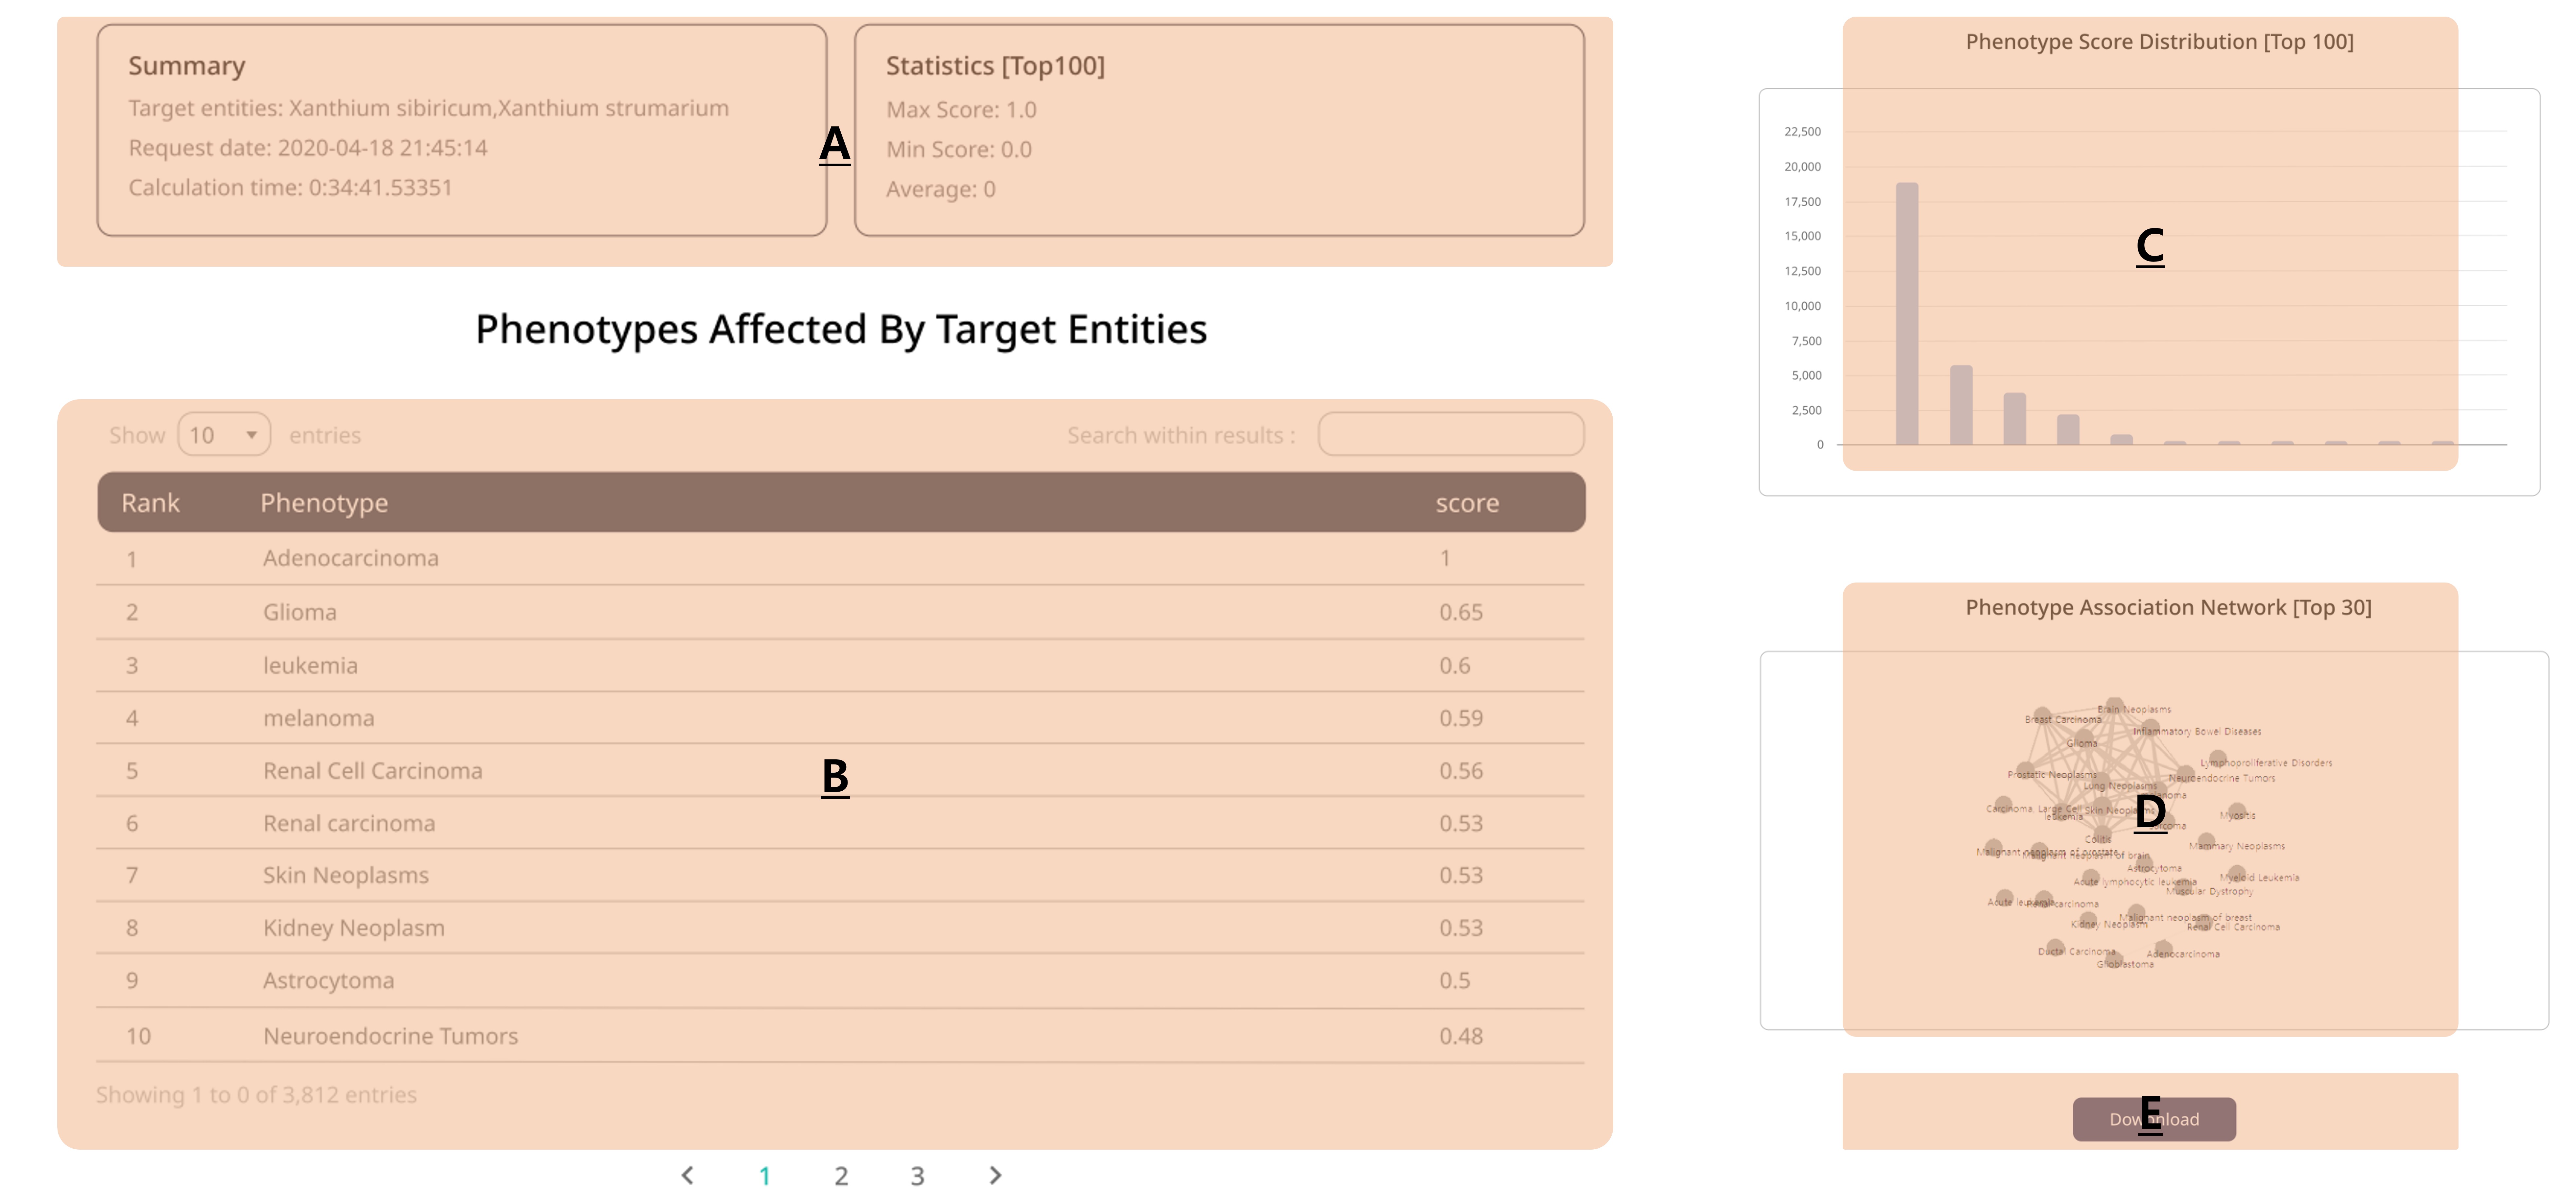
Result of ‘Effect Prediction’ analysis
A : Summary and statistics of the analysis result.
B : A list of top-N phenotypes from the analysis result. You can select the number of entries in a page, and search within the result.
It shows top-N phenotypes which are most affected by your input entities.
The higher score means the more affected phenotype.
The score is calculated by the probability with expected number of visiting times during the network propagation algorithm from your input entities.
C : A histogram of phenotype’s scores.
D : A network with the top-N phenotypes.
A node is one of top-N phenotypes and a edge is a similarity(0~1) between two phenotypes.
The closer two phenotypes are, the higher similarity score is.
You can check which phenotypes are clustered each other.
E : Download button for the phenotype list.
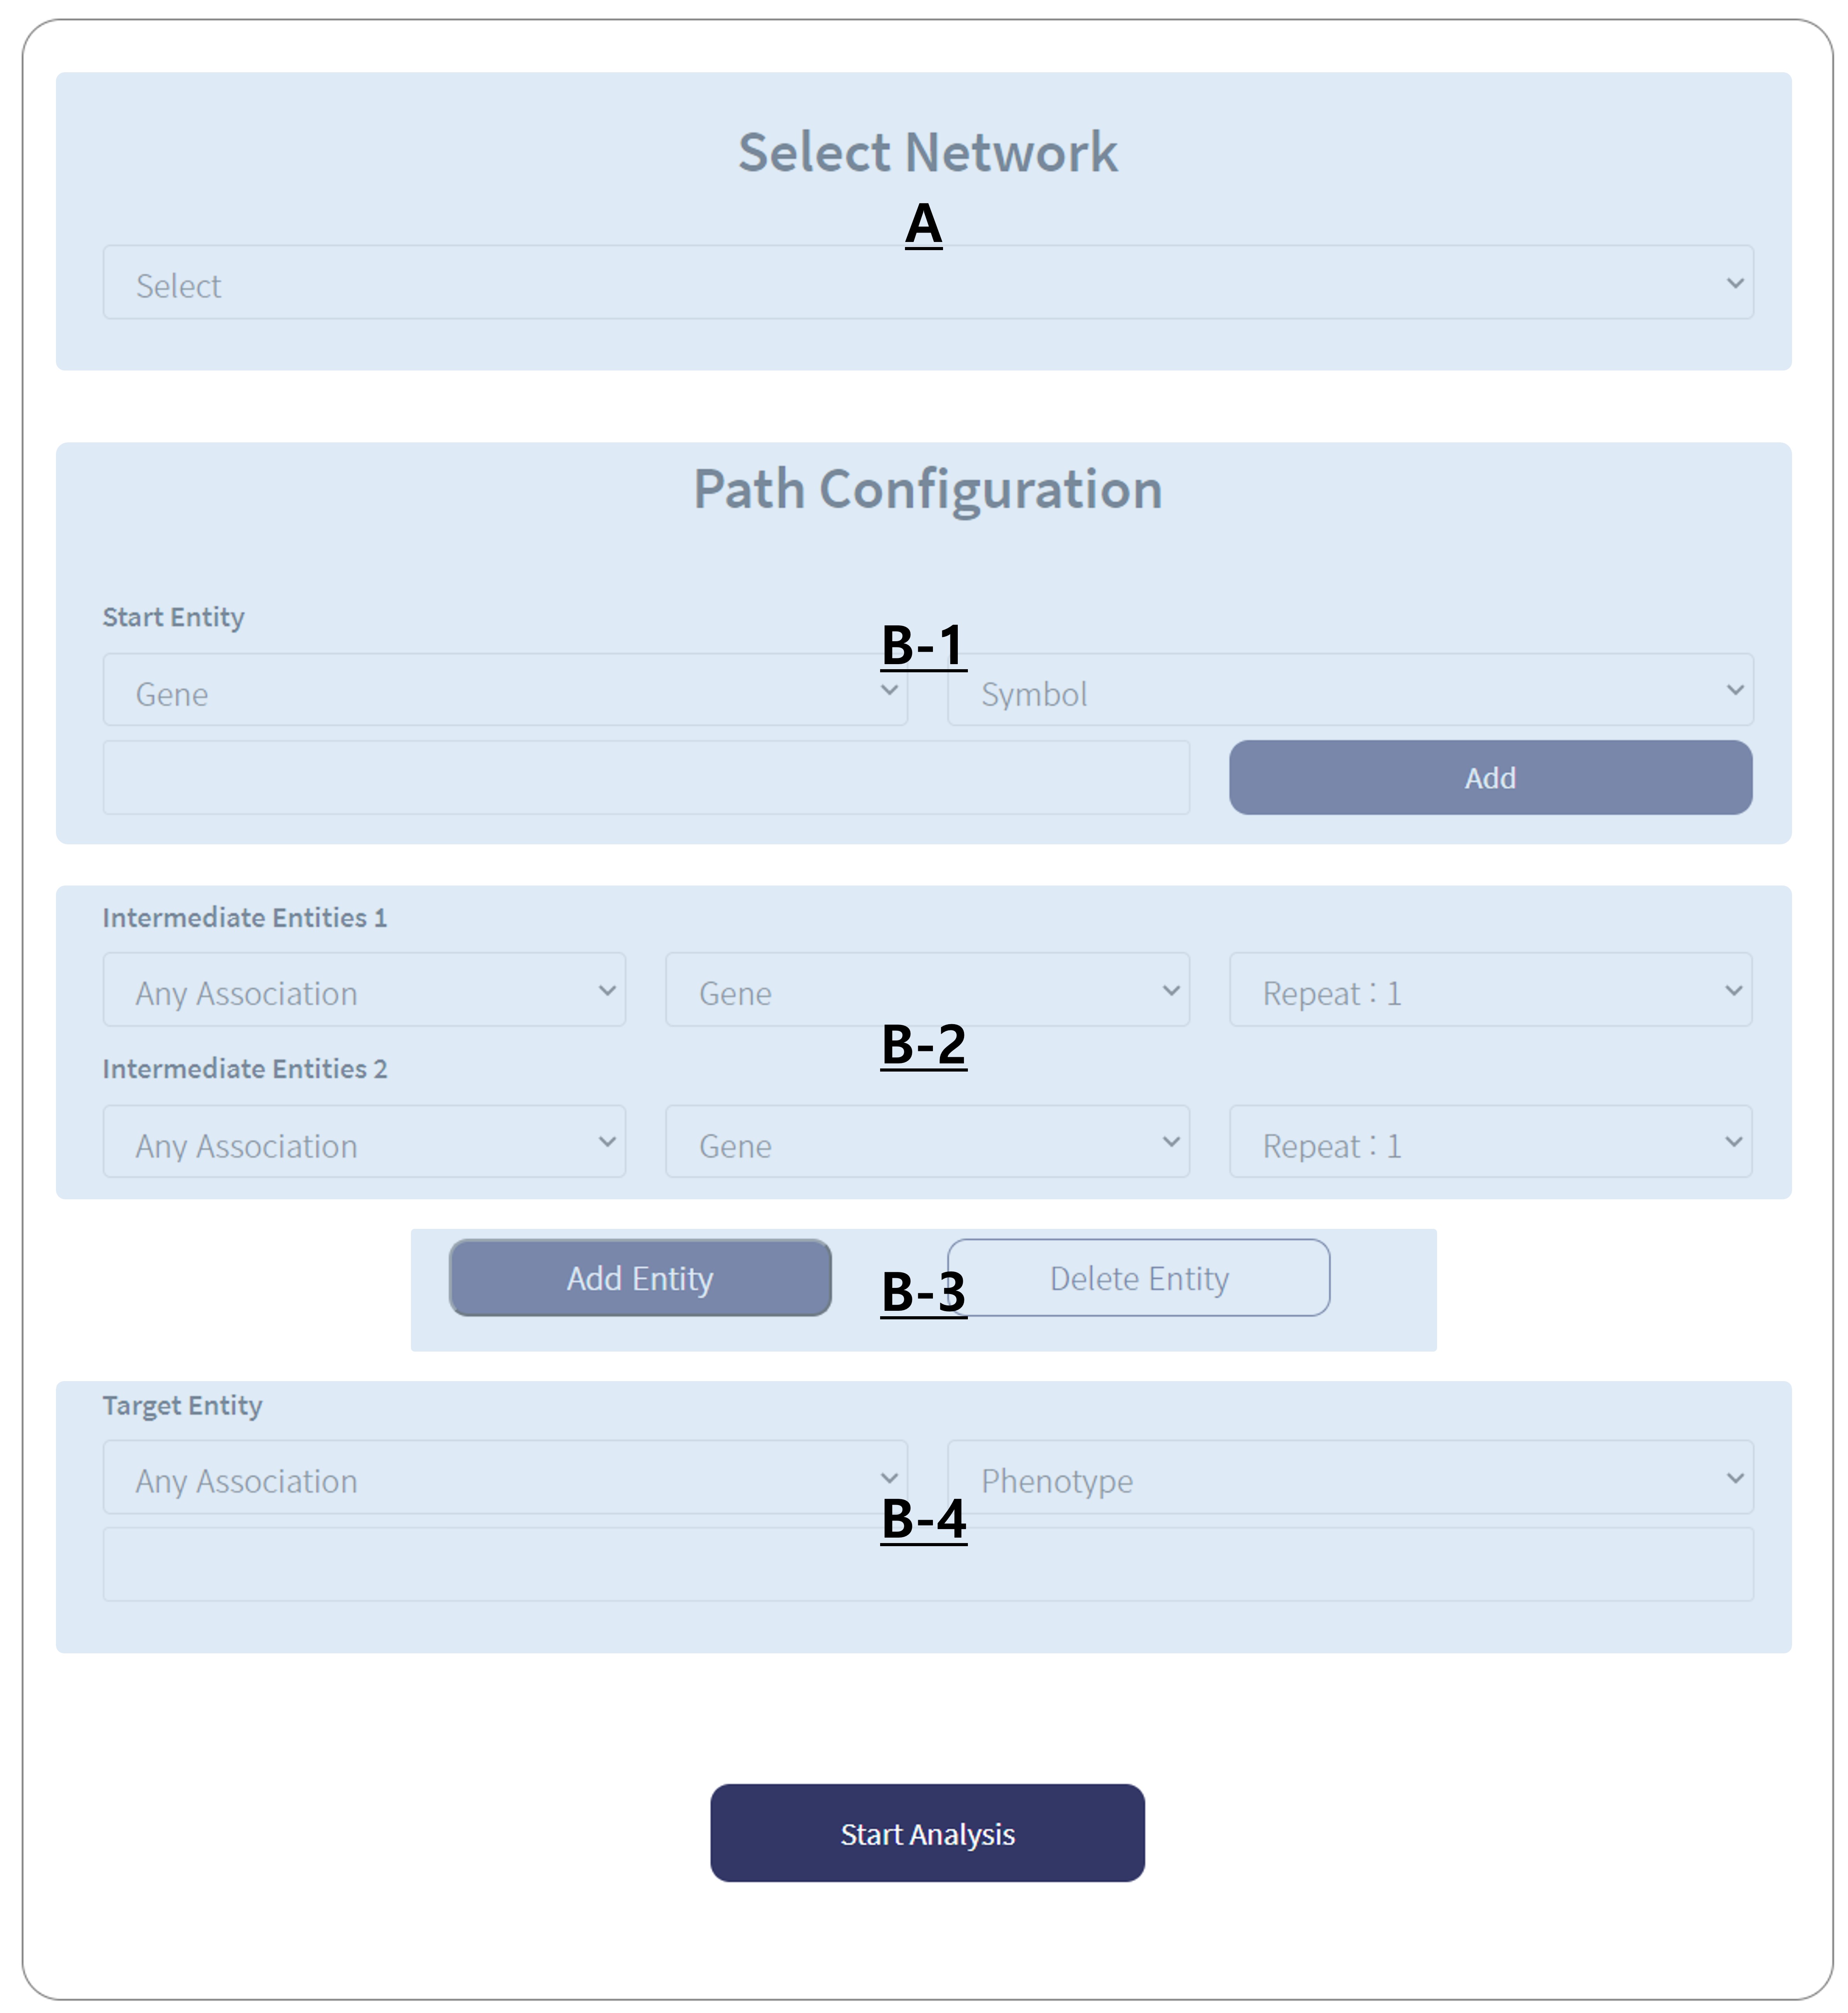
How to do ‘Path Scaffold’ analysis
Select a network depending on your analysis purpose. (A) The detail descriptions of networks are described in the section of ‘How to select a network?’.
Choose a type of start entity and one of the standard ID type. And then write down a entity with appropriate type you choose before. (B-1)
Type of start entity can be one of ‘Gene’, ‘Compound’, ‘Biological Process’, ‘Molecular Function’
The analysis algorithm finds all possible pathways in the network starting from this entity.
Add intermediate entities of the scaffold. (B-2)
Select association type, entity type and the number of repeat.
If you set repeat more than two, same association and entity type are automatically added according to the number of repetitions.
Add or delete intermediate entities of your scaffold.(B-3)
Choose types of target(end) entity and write down of the target entity.(B-4)
Click the ‘Start Analysis’ button
Result of ‘Path Scaffold’ analysis
A : Summary and statistics of the analysis result.
B : A network of top-10 paths in confidence score.
C : Information of selected node in panel B.
D : A list of scaffolds in order of confidence score.
E : Download button for the all paths and their confidence score.